Grafana stands out as the leading open-source platform designed for the visualization of data, seamlessly amalgamating information from various data sources into both graphical and tabular formats. This empowers users to efficiently and promptly monitor, assess, and interpret crucial data, aiding in making informed decisions. Its expansive and engaged community provides valuable support to address any potential challenges. Additionally, Grafana boasts a number of plugins and extensions that significantly augment its features, enabling users to effortlessly install and customize plugins to expand the platform’s capabilities.
However, this application does not store data and needs a logical data store, also called a log aggregation component. Fortunately, Grafana offers compatibility with a wide array of major database systems, including MySQL, InfluxDB, and others. Among the more recent additions to the list, Loki has gained substantial popularity as a favoured choice for use with Grafana. While Loki draws inspiration from Prometheus, this storage component boasts numerous advantages that set it apart.
In this guide, we will thoroughly explore Grafana Loki and delve into its applications.
What Is Grafan Loki?
Grafana Loki is an open-source, horizontally scalable log aggregation system designed for use in cloud-native environments. It is particularly well-suited for collecting, storing, and querying log data generated by applications and infrastructure components in distributed systems.
Key Characteristics Of Loki
Scalability: Loki is designed to scale horizontally, allowing it to handle large volumes of log data efficiently, making it suitable for dynamic and rapidly changing environments.
Cost-Efficient Storage: Loki uses a unique approach called “logQL” to store log data in a cost-efficient manner by storing only unique log lines and efficiently compressing data.
Querying: It provides a powerful query language (logQL) that enables users to search and filter log data effectively. This makes it easier to troubleshoot issues and gain insights from log information.
Integration: Loki can be seamlessly integrated with other Grafana components, such as Grafana itself, to create comprehensive monitoring and observability solutions.
How Loki Is Different From Other Log Aggregation Systems
Loki requires less storage than other databases; this is because it does not index the whole log message. This database only labels as well as metadata of each message it receives. The entire log message is compressed and available for querying in Grafana. This way, Loki can process lots of messages in very little time.
But there’s a downside: it lacks the sophisticated search capabilities that its counterparts possess. So, if you need to do very advanced searches, you need to use a different system that’s better than Loki. This storage component is good for quick search and efficient storage but not the best if you need advanced searching options.
Components Of Grafana Loki
It consists of four components: Distributor, query, querier, and ingester.
Distributor
The role of the distributor module is to handle the data coming from different sources.
Data that is considered valid is divided into smaller pieces and sent to multiple processors called “ingesters” all at once. The distributor, which is responsible for managing the data flow, uses labels to organize and manage log data. Without these labels, Grafana Loki can’t create the index it needs for searching.
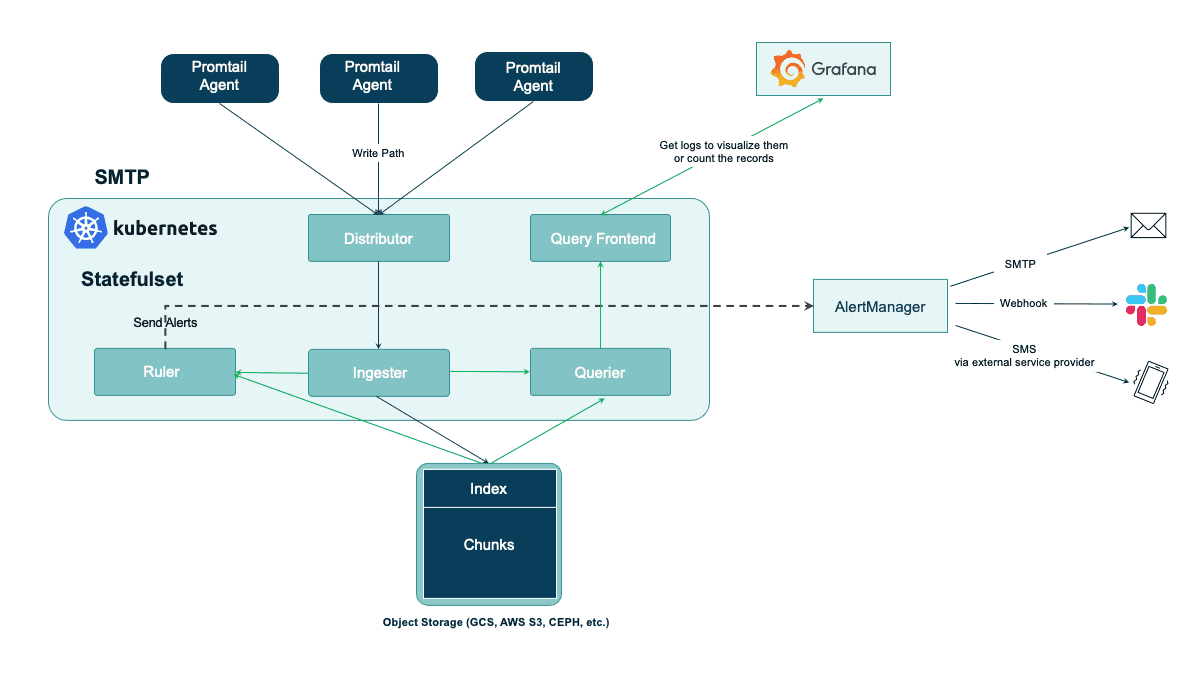
Ingester
The ingester module stores data for the long term. Loki ingots just store index metadata in lieu of keeping the whole log. It can use storage options like AWS S3, Apache Cassandra, or local files.
The ingester also helps you find things quickly, but if it crashes before saving, some data might be lost forever. If users don’t set it up well, Loki might lose logs from the ingester without a way to get them back.
Querier
In the Loki database, the querier module is responsible for managing user questions about data stored in the ingester and object storage. It starts by looking for answers in local storage and then checks the long-term storage.
Because it looks in multiple places, the querier can sometimes find the same data more than once. However, it has a way to make sure it only shows you data that has the exact same time, labels, and log content once. This helps avoid showing duplicate information in your search results.
Query Frontend
The query frontend module has a feature where it can offer API endpoints for questions. These points help when you have huge queries. The query front split the large questions into smaller ones and looked for answers at the same time. This can be handy if you’re new to Loki and don’t want to spend a lot of time setting up the querier right away.
How Grafana Loki Functions: A Closer Look
Now let us see how Grafana Loki actually works
Collect Logs with Promtail: Imagine Promtail as a specialized tool that gathers logs specifically for Loki. It finds logs in various places using a smart method like Prometheus. It can also organize, change, and pick out the logs you need before sending them to Loki.
Store Logs in Loki: Instead of organizing logs like a library, Loki groups them into categories and attaches labels. This is different from traditional systems that index every word in every log line. Loki’s way not only saves money but also lets you quickly search for logs as soon as they reach Loki.
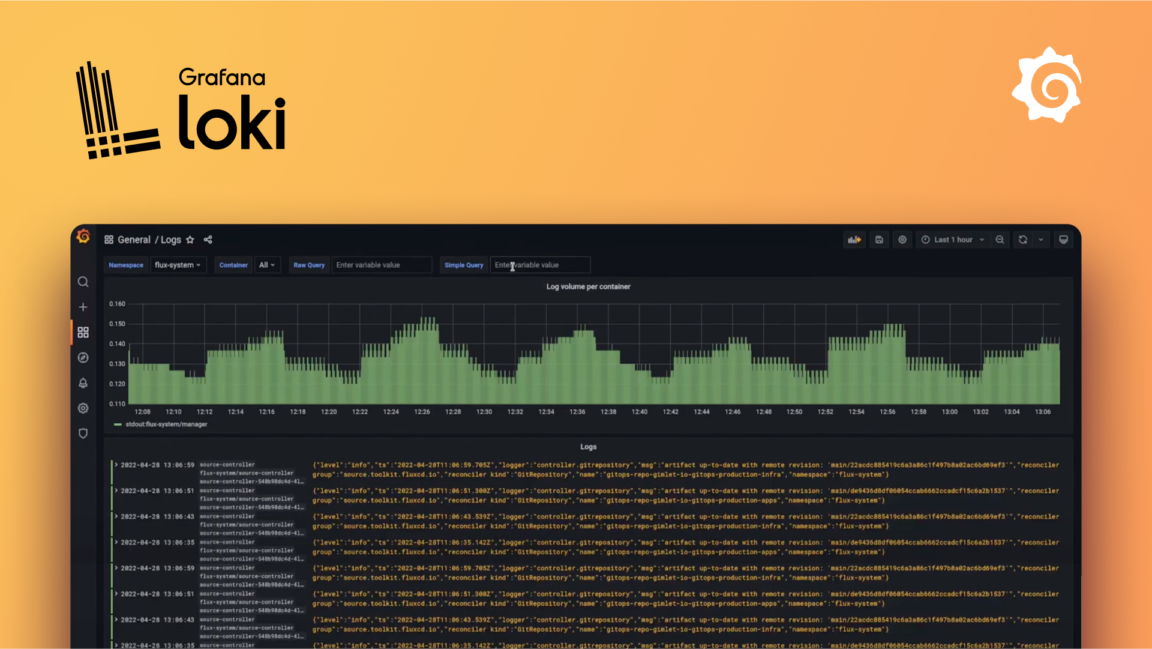
Explore Logs with LogQL: To look at your logs, you use Loki’s search language called LogQL. It’s like asking questions to find specific logs. You can do this within Grafana, where you see logs and other data together. Or, if you like using commands, you can use LogCLI.
Set Up Alerts: Finally, if you want to be notified when something important happens in your logs, you can create alerting rules in Loki. When Loki spots something concerning, it passes the message to Prometheus alert manager, which then sends it to the right team.
Application And Uses Of Loki
Loki serves various essential roles in different scenarios, offering versatile solutions for a range of needs. Here are some prominent use cases for Loki:
Business Intelligence
Loki is quite useful for mining valuable insights from log data. Loki aids in the interpretation of log data, empowering organizations to formulate innovative strategies for business growth. For instance, by analyzing log data, you can assess conversion rates from specific advertising channels.
Cybersecurity
In an era marked by a surge in cybersecurity threats, Loki proves indispensable for safeguarding e-commerce platforms and other systems. By scrutinizing logs with Loki, you can identify potential threats, anomalies, or malicious activities within your organization’s infrastructure. In the unfortunate event of a successful breach, Loki assists forensic teams in reconstructing the sequence of events and tracing the activities of hackers.
Debugging and Troubleshooting
Loki is a great tool for DevOps teams seeking swift resolutions to technical issues. It offers rapid insights into questions like when an application crashed, the reasons behind the crash, and the actions that led up to the crash, facilitating effective debugging and troubleshooting.
Monitoring
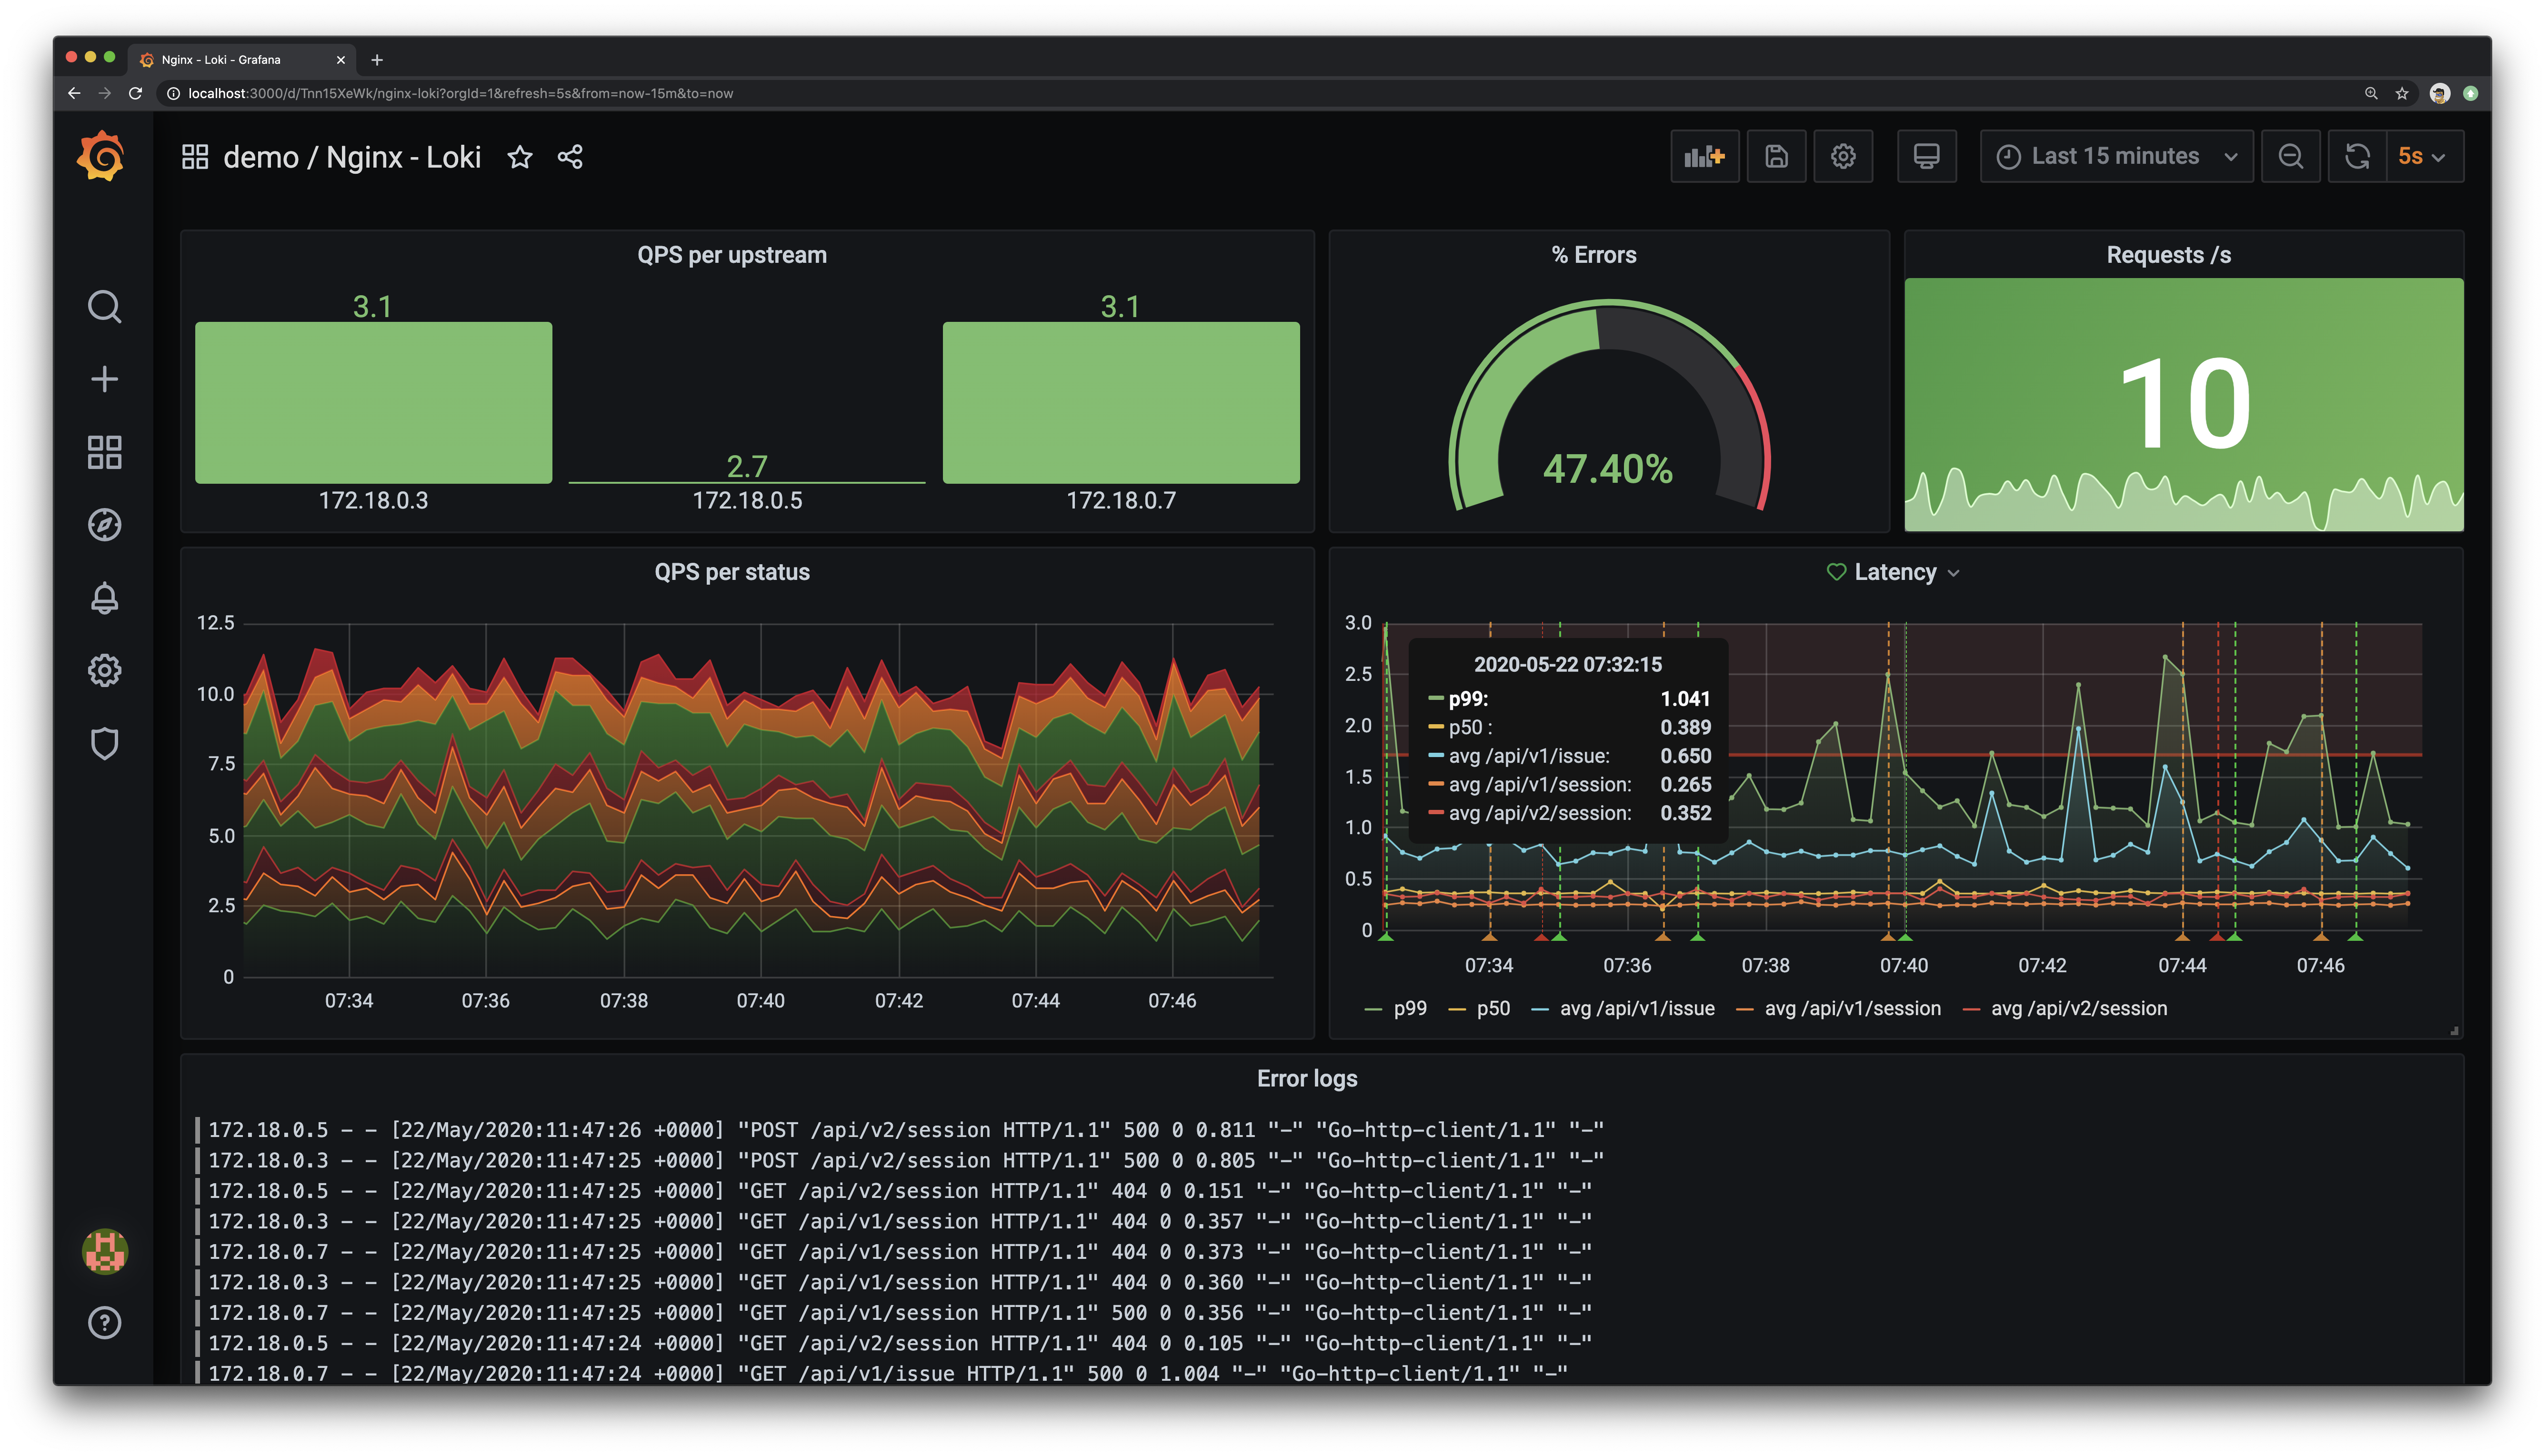
While Prometheus is a popular choice for monitoring, integrating Loki into your log monitoring toolkit can provide a wealth of additional information. Loki enables the tracking of error rates on your website by scanning log data and issuing alerts when predefined thresholds are breached. This proactive approach helps in maintaining the reliability and performance of your systems.
Final Words
Just a few microseconds of downtime in production is not unacceptable. Swift action is imperative when addressing these issues. Effective debugging relies on robust infrastructure logging and monitoring. This will not only facilitate proactive cost and resource optimization but also enhance the early detection of potential future problems. Various logging and monitoring solutions are available in the market.
One such solution is Grafana Loki, a powerful open-source log aggregation tool designed for horizontal scalability. To leverage Loki, log storage integration with a cloud account is required.